Data analysis can be exploratory, broad, and complex. That’s why it’s important to differentiate between qualitative vs quantitative data.
According to a Deloitte report, the improvement of data and analytics usage is important to 68% of Chief Data Officers. Understanding the differences between these two types of data helps facilitate this improvement.
Moreover, it helps enhance how you gather and interpret customer information.
Let’s explore the difference between qualitative vs quantitative data. As a plus, I’ve highlighted some qualitative vs quantitative data examples and how each of these data forms is collected.

What Is Qualitative Data?
Qualitative data, or categorical data, is non-numerical information that helps you interpret customer behavior.
This type of data describes or classifies information and cannot be counted or measured. Plus, it usually comes in labels or words that describe certain customer traits or characteristics.
A major characteristic of qualitative data is its subjective nature. It helps you understand the “why” and “how” behind your data. This allows you to study customer perceptions, emotions, and motivations.
Here’s an example of what qualitative data looks like:
You can collect qualitative data in different ways. This includes:
- Interviews: Conducting face-to-face or virtual conversations allows you to engage with your customers directly. You can ask what they think about your brand and what their experience is with your products or services. This helps you explore their individual perspectives and attend to customer complaints more effectively.
- Focus Groups: Here, you can bring a small group of customers together for a discussion. This way, you get collective insights and shared experiences about your business.
- Observations: Directly observing how your customers interact with your product gives you valuable insight into their behavior and social dynamics. You can also assess how their environment impacts their decision-making process.
- Open-ended Surveys and Questionnaires: You can build a form with specific questions and let customers freely express their feelings and thoughts about your business. This allows you to get diverse perspectives about your products and services. In the medical industry, medical professionals use the EHR system to get customers’ opinions about their health care record with their pros and cons.
Document Analysis: With this method, you get data from video, textual, and audiovisual sources. This includes documents, pictures, videos, and social media posts. For instance, you can use a LinkedIn data scraper to collect information about your customers’ LinkedIn profiles to help you understand them better and create more targeted campaigns.

Types of Qualitative Data with Examples
You need to understand the different qualitative data types to properly differentiate qualitative vs quantitative data.
Here are the three types:
Binary Data
This qualitative data type is represented using a combination of ones and zeros. This is the only data category that can be directly understood and performed by a computer.
You can use binary data to create statistical models that predict customer behavior on a zero scale.
An example of this kind of data is the information you get when you send a promo code for a product to all or a group of customers. When the promo period expires, you get information on customers who purchased the product and those who didn’t.
With this data, you can optimize your product and service portfolio to ensure that they’re valuable and enticing, resulting in more sales.
Nominal Data
Also referred to as nominal scaled data or labeled data, this type of data is used to label variables that numbers can’t measure.
With nominal data, you can get information like a customer’s purchase history and demographic. Even more, you can use it to understand how customers feel about your business.
A good example is sending out product surveys to get first-hand information on what your customers want.
Here’s what this kind of survey would look like:
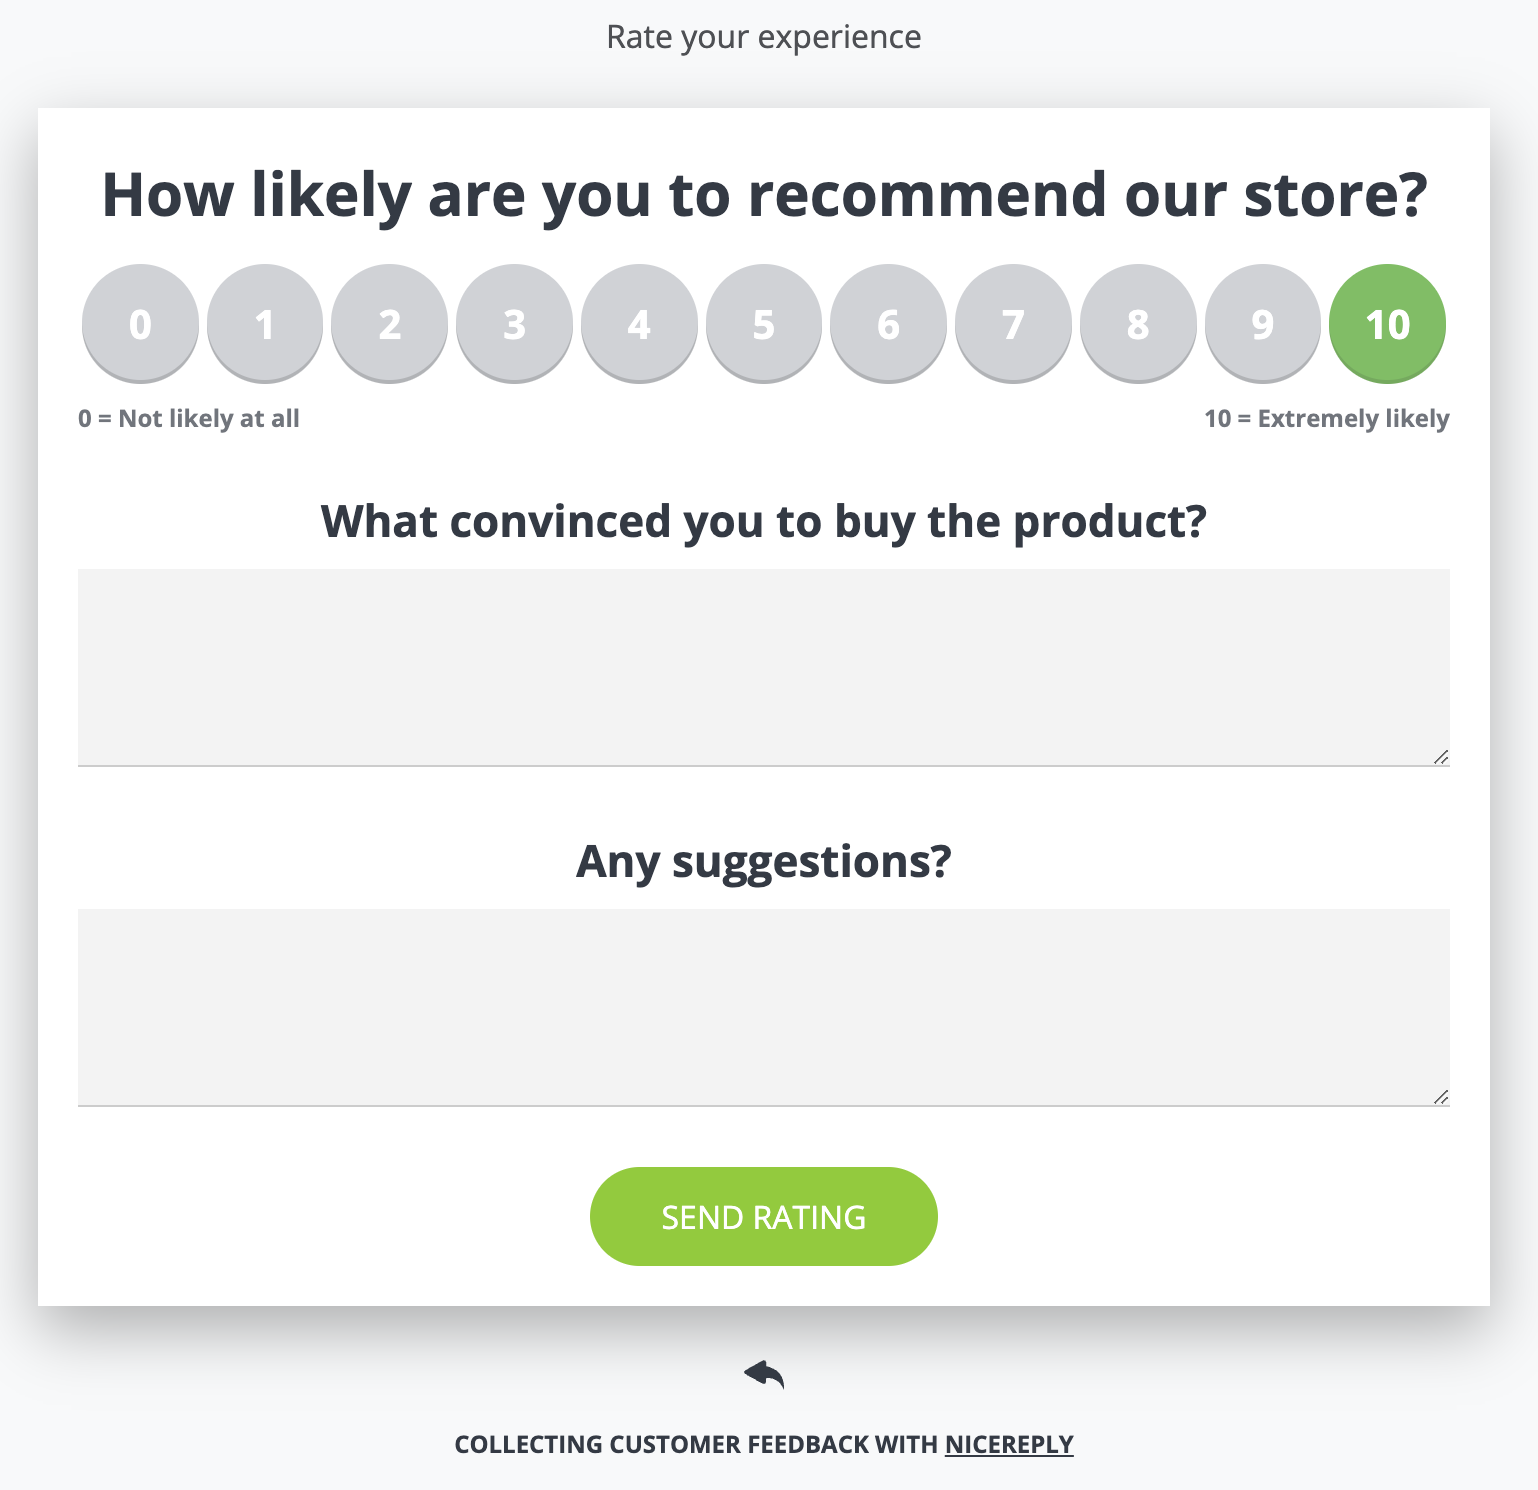
With this survey, you can get insight that guides your product creation process. This shows that you’re listening to your customers, helping build trust and improve retention.
Ordinal Data
This is simply qualitative data categorized on a ranging scale or specific order. When you use ordinal data, the difference between each category doesn’t matter as much as the order of the qualitative information.
An example of this kind of data is the Net Promoter Score (NPS) survey. The results you get with NPS are on a 0-10 satisfaction scale.
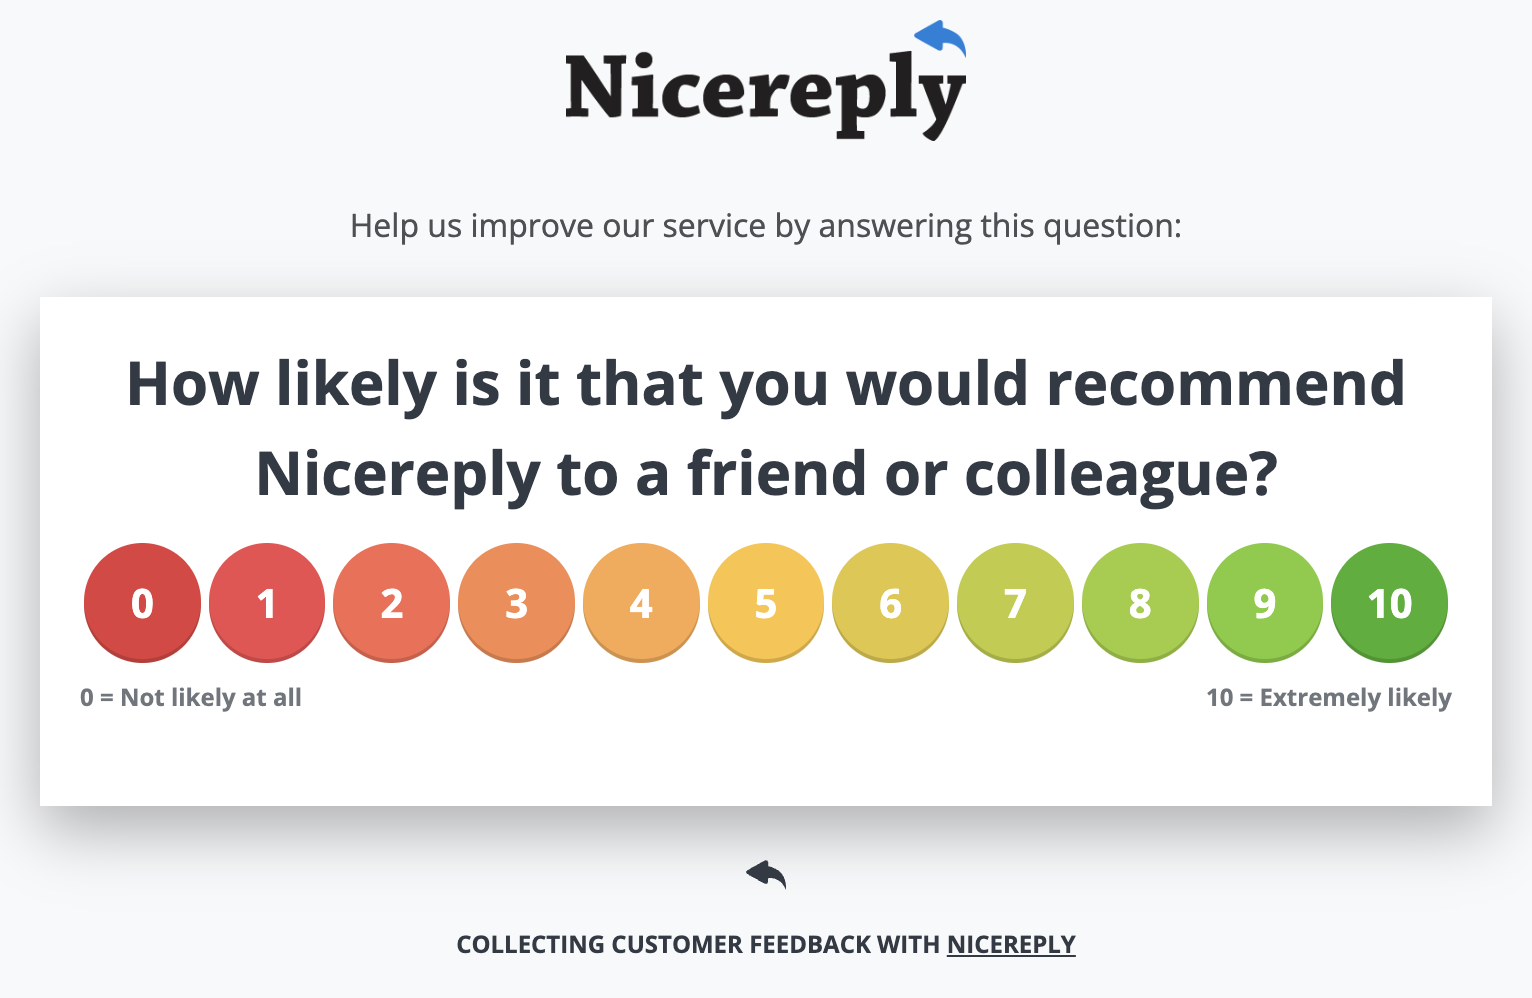
Using open-ended questions for this survey helps you get insights into customer trends and thought processes. For example, you can ask probing questions to understand the reasoning behind the score they picked.
What Is Quantitative Data?
As the name implies, quantitative data is any information that can be measured or counted and given a numerical value.
You use this type of data when you need answers to “what,” “how often,” and “how many” questions. Use them for statistical analysis and mathematical calculations to make informed decisions on how to improve your products and services.
In addition, quantitative data is objective. You can use statistical methods to analyze this data to identify customer buying frequency and quantity.
Here’s an example of quantitative data:
You can collect quantitative data using different methods. Here are some ways:
- Surveys: This is where you question a large set of people using ranking exercises, Likert scales, or multiple-choice questions. The questions are the same for everyone involved and are close-ended. This ensures that the questionnaire is clear and unbiased.
- Experiments: This gives you a more controlled approach to collecting data. You can adjust different variables and measure their impact on specific outcomes. For instance, you can implement a product placement strategy to see how customers react when exposed to your product in different contexts.
- Website Traffic Data: The web analytic tools curated and reviewed in the Attrock guide, can be used to obtain information on conversion rates, page views, user demographics, and website visits. This quantitative data helps you understand how users interact with your website, which you can then use to optimize your site for better engagement.
- Sales Figures: Your product sales, customer profiles, generated revenue, and other sales data count as quantitative data. Analyzing this gives you insight into seasonal trends, customer preferences, and your company’s popular products. This helps you improve your product offerings and tailor your marketing strategies, such as contactless marketing, effectively.
Social Media Analytics: Metrics like social media likes, comments, and shares provide quantitative data and insight. This helps you gauge customer engagement and brand sentiment.
Types of Quantitative Data with Examples
There are three types of quantitative data, each with its own unique values. Let’s explore each type and highlight some examples.
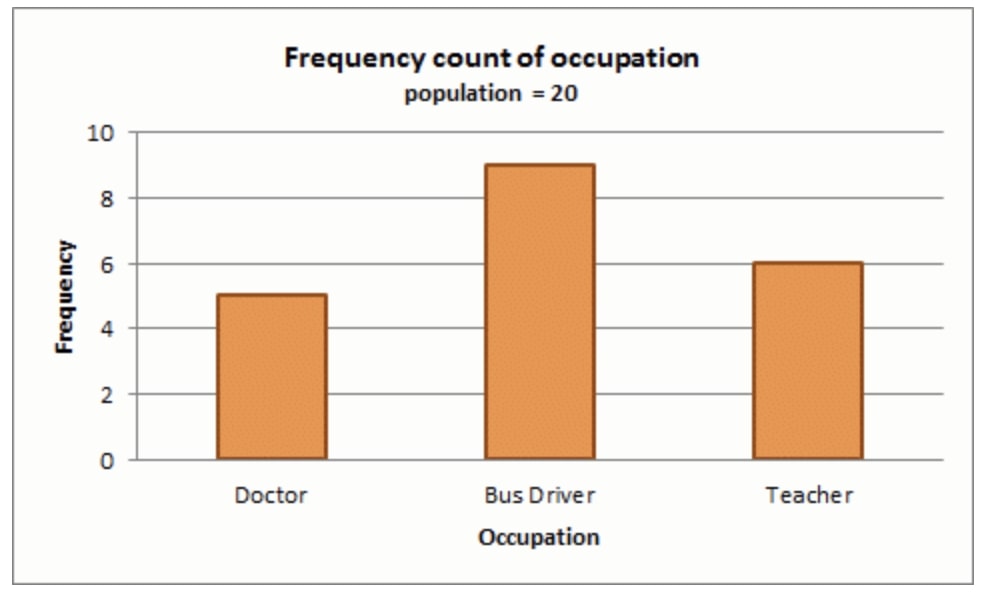
Discrete Data
This type of quantitative data can only contain specific numerical values. It’s usually represented using pie charts, bar graphs, and tally charts.
Typically, discrete data involves integers-whole numbers and not fractions. For instance, the number of subscribers on your mailing list is discrete—you can’t have 21.5 subscribers.
Other examples of discrete data include:
- Number of clicks on your social media ad
- Number of products sold
- Number of store visitors
- Number of employees
- Frequency of product purchases within different customer segments
- Number of new social media followers in a specific span of time
Continuous Data
Unlike discrete data, continuous data can take any numerical value within a specific range. They can be broken down infinitely into smaller parts.
Some examples of this kind of data include:
- Average customer wait time
- Customer service call duration
- Website bounce rate
- Cost per acquisition
- Click-through rate (CTR) on individual email campaign links
Interval Data
This data builds on continuous data because it assigns equal intervals between values. It includes customer age ranges, website bounce rate by device type, and Customer Satisfaction Scores (CSAT).
Ratio Data
This data has a true zero point. You can easily make meaningful comparisons across different scales; for example, comparing a customer’s lifetime value with their acquisition cost.
Examples of this kind of data include:
- Website click-through rate
- Website bounce rate by time of day
- Profit margin
- Conversion rates
Advantages and Disadvantages of Qualitative vs Quantitative Data
Every type of data comes with its pros and cons. It’s important to know what these are when sourcing data for analysis.
Let’s explore the advantages and disadvantages of qualitative vs quantitative data.
Advantages of Qualitative Data
- Offers in-depth customer insights while allowing you to explore different contexts
- Provides insight into customer behavior
- Is an excellent choice for exploratory research
- Provides predictive elements for continuous data
Disadvantages of Qualitative Data
- Can be open to different interpretations
- May require multiple data sessions
- Takes time
- Can be harder to collect
Advantages of Quantitative Data
- Quick and easy to collect through methods like web scraping, allowing you to work with large samples
- Less susceptible to bias
- Presents findings in a straightforward way
Disadvantages of Quantitative Data
- May lack context and depth
- Can be limited
- Focuses solely on numbers
Key Differences Between Qualitative and Quantitative Data
You need different analyses, hypotheses, and collection methods when conducting research. Hence, it’s important to understand the differences between qualitative and quantitative data.
The following table highlights the key differences between these two.
| Characteristics | Qualitative Data | Quantitative Data |
| Measurability | Generally not measurable | Measurable |
| Purpose | To understand motivations, opinions, and experiences | To identify relationships, patterns, and trends |
| Nature of data | Descriptive rather than numerical | Expressed using numerical values |
| Analysis method | Discourse, content, and thematic analysis | Statistical and regression analysis and data visualization |
| Research methodology | Exploratory | Conclusive |
| Measured quantities | Uses descriptive words and adjectives to refer to color, demographics, and other qualities | Amount, duration, price, and length |
| Outcome | Recommends final course of action | Provides initial understanding |
| Data collection techniques | Interviews, focus groups, observations, open-ended surveys and questionnaires, and document analysis | Surveys, experiments, website traffic data, sales figures, and social media analytics |
| Approach | Subjective | Objective |
| Determines | Depth of understanding | Level of occurrence |
| Sample | A few unrepresentative samples | Wide numbers of representative samples |
| Reliability | Less objective and reliable | More objective and reliable as statistics add credibility |
When to Use Qualitative vs Quantitative Data
Both qualitative and quantitative data give you insights into customer behavior. However, to achieve your goal, you need to choose the type of data that aligns with your objectives.
You can use qualitative data when you want to analyze and interpret non-numerical data. This type of data helps you understand the “why” behind customer trends, behaviors, or characteristics.
On the other hand, you can use quantitative data to measure the impact of your campaigns. A good example is the number of customers within a specific demographic that purchased a product through any of your marketing mediums.
Additionally, you can combine both qualitative and quantitative analysis to gain multi-dimensional insights. For instance, after using website analytics to discover low conversion rates, you can conduct user interviews to find out the reasons behind behaviors like cart abandonment.
Qualitative vs Quantitative Data Analysis in Research
Because of the varied nature of these data types, you need to take extra care to obtain meaningful insights.
You can unlock the full potential of both qualitative and quantitative data by understanding the distinct ways to analyze them.
Here’s how to properly analyze these data types:
Quantitative Data Analysis
This requires statistical methods for analysis. Common techniques include:
- Central Tendency Measures: Here, you find the average number in your data, including mean, median, and mode. These help you paint a wider picture of your customer behavior.
- Dispersion Measures: With this technique, variance and standard deviation help you see the variability in customer data.
- Hypothesis Testing: This method allows you to test predictions using statistical data. For instance, you can check if your ads or campaigns are increasing sales numbers.
- Regression: With this method, you can explore the relationships between variables. A good example is checking how income affects website engagement.
You can use a data mining service to get all the data you need, but you’ll also have to analyze them using data visualization tools. These tools translate complex statistics into simple dashboards, graphs, and charts. For instance, you can use line graphs to visualize your website traffic trends or pie charts to showcase your customer demographics.
Qualitative Data Analysis
With qualitative data, you’re analyzing themes and patterns to interpret non-numeric and conceptual information and customer feedback.
The methods you can use to analyze qualitative data include:
- Thematic Analysis: This identifies patterns and themes within your data. Here, you code data by assigning labels. A common use case is customer feedback analysis with NPS tagging and NPS surveys to identify buying patterns.
- Content Analysis: This method involves systematic text analysis to identify patterns and features. It can be social media posts, survey responses, customer success calls, or interview transcripts. For example, you can label or categorize all mentions of “price” within your customer feedback to see how much pricing influences consumer decisions.
Narrative Analysis: This involves identifying, analyzing, and interpreting customer stories through interviews, testimonials, or any other text data. It helps you understand how customers feel about your product. You can also identify trends in your customers’ behaviors to provide more personalized experiences.
To Wrap Up
Qualitative and quantitative data both play complementary roles when it comes to data analysis. However, they each have their unique characteristics.
While qualitative data gives you insight behind the numbers, quantitative data quantifies trends and patterns.
Furthermore, qualitative data are collected through interviews, focus groups, observations, open-ended surveys and questionnaires, and document analysis.
On the other hand, you can get quantitative data through surveys, experiments, website traffic data, sales figures, and social media analytics.
Knowing these differences helps you decide which type of data fits your overall objective. This way, you can get accurate insights and make informed decisions about your products, services, and marketing efforts.